Aggregating Application Logs from Kubernetes Clusters using Fluentd to Log Intelligence

One of the key issues with managing Kubernetes is observability. Observability is the ability for you as an admin or developer to gain insight into multiple data points/sets from the Kubernetes cluster and analyze this data in resolving issues.
Observability in Kubernetes uses cluster and application data from the following sources:
- Monitoring metrics — Pulling metrics from the cluster, through cAdvisor, metrics server, and/or prometheus, along with application data which can be aggregated across clusters in Wavefront by VMware.
- Logging data — Whether its cluster logs, or application log information like syslog, these data sets are important analysis.
- Tracing data — generally obtained with tools like zipkin, jaeger, etc. and provide detailed flow information about the application
In this blog we explore the logging data aspects and describe how to aggregate application logging data from containers running on kubernetes into VMware Log Intelligence.
In particular we will investigate how to configure, build and deploy fluentd daemonset to collect application data and forward to Log Intelligence.
A daemonset as defined in Kubernetes documentation is:
“A DaemonSet ensures that all (or some) Nodes run a copy of a Pod. As nodes are added to the cluster, Pods are added to them. As nodes are removed from the cluster, those Pods are garbage collected. Deleting a DaemonSet will clean up the Pods it created.”
Prerequisites
The following write up assumes the following:
- application logs are output to stdout from the containers — a great reference is found here in kubernetes documentation
- privilege access to install fluentd daemonsets into “kube-system” namespace.
Privilege access may require different configurations on different platforms:
- KOPs — open source kubernetes installer and manager — if you are the installer then you will have admin access
- GKE — turn off the standard fluentd daemonset preinstalled in GKE cluster. Follow the instructions here.
- VKE — Ensure you are running privilege clusters
Application logs in Log Intelligence
Once configured and deployed, fluentd properly pulls data from individual containers in pods. These logs can be visualized and analyzed in Log Intelligence.
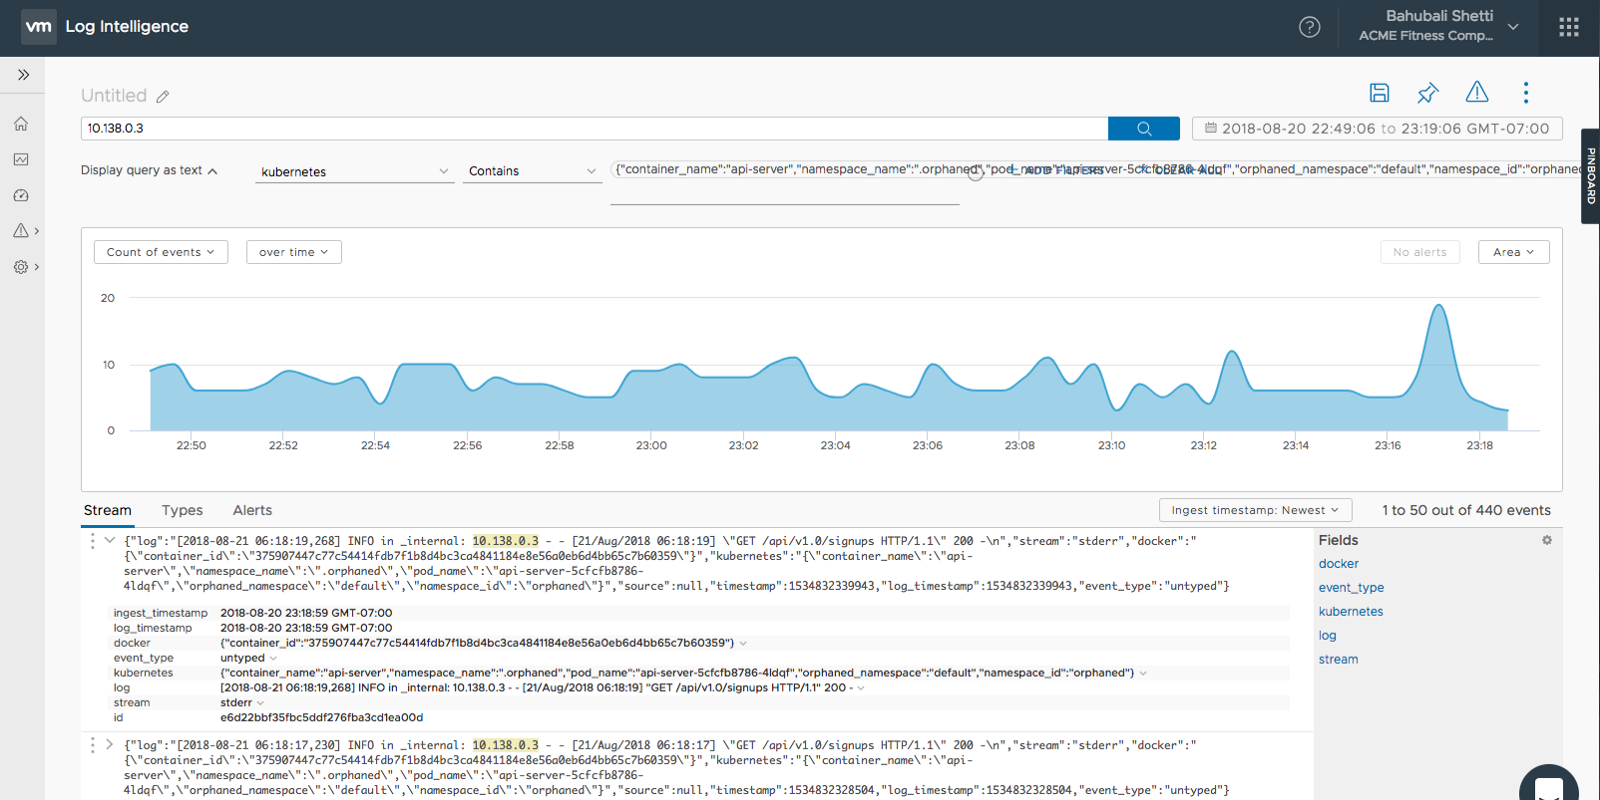
The following captures show logs from a simple Flask application called api_server running on a pod in a kubernetes cluster.
application data from flask container on kubernetes (1)
As the charts above show, Log Intelligence is reading fluentd daemonset output and capturing both stdout, and stderr from the application.
To get a better appreciation for what is being viewed in Log Intelligence, its useful to view the container logs in Kubernetes.
Here is a sample output (in stdout) of logs from the api_server container:
As you can see these logs were output to stdout, and then picked up by fluentd and properly forwarded to Log Intelligence. The log output is pushed into the Kubernetes cluster and managed by Kubernetes.
As noted in Kubernetes documentation:
“Everything a containerized application writes to stdout and stderr is handled and redirected somewhere by a container engine. For example, the Docker container engine redirects those two streams to a logging driver, which is configured in Kubernetes to write to a file in json format.”
Once the application logs are successfully ingested into VMware Log Intelligence, there are various methods to leverage its features to accelerate your troubleshooting without having to dive deep into each log stream. On the home screen, you can view your Recent Alerts which occur per the Alerts Definitions defined. For example, you may want to be alerted when application logs have an error within the content. See below an example of an alert being triggered over a period of time.
creating an alert
Building, configuring, and deploying fluentd
Fluentd comes with standard daemonsets. Here are few that can be found in the Fluentd github repository:
- Elasticsearch
- Syslog
- GCS
- S3
- etc
What about Log Intelligence? Until an official VMware Log Intelligence daemonset is created, the following instructions will help create a fluentd daemonset using the fluentd syslog daemonset.
Create a docker image with the right configuration
First step is to create a docker image with the right configuration for Log Intelligence. This image will be used in deploying the daemonset.
I started with fluentd syslog alpine container from the following repository:
- https://github.com/fluent/fluentd-kubernetes-daemonset/blob/master/docker-image/v0.12/alpine-syslog/
First step is to clone the entire git repo
git clone
Next in the conf directory for the alpine-syslog image build look for fluent.conf
~/fluentd-kubernetes-daemonset/docker-image/v0.12/alpine-syslog/conf/fluent.conf
Next modify this file as follows:
    # AUTOMATICALLY GENERATED
    # DO NOT EDIT THIS FILE DIRECTLY, USE /templates/conf/fluent.conf.erb

     kubernetes.conf

    <match **>

     http_ext
      endpoint_url          "#{ENV['LINT_HOST']}"
      http_method           post
      serializer            json
      rate_limit_msec       100
      raise_on_error        true
      raise_on_http_failure true
      authentication        none
      use_ssl               true
      verify_ssl            false
       <headers>
        Authorization "Bearer #{ENV['LINT_TOKEN']}"
        Content-Type application/json
        format syslog
        structure default
       </headers>
    </match>
What we have added is two environment variables to enable connectivity to Log Intelligence
- LINT_HOST — the Log Intelligence host
- LINT_TOKEN — the auth token to connect to Log Intelligence
Next we need to add a library into Dockerfile to ensure we can use the two variables to properly connect to Log Intelligence. We will add the following library into the Dockerfile located here:
~/fluentd-kubernetes-daemonset/docker-image/v0.12/alpine-syslog/Dockerfile
ADD ---> fluent-plugin-out-http-ext -v 0.1.10
Here is the modified Dockerfile:
    # AUTOMATICALLY GENERATED
    # DO NOT EDIT THIS FILE DIRECTLY, USE /templates/Dockerfile.erb

    FROM fluent/fluentd:v0.12.43
    LABEL maintainer="Eduardo Silva <
    >"
    USER root
    WORKDIR /home/fluent
    ENV PATH /fluentd/vendor/bundle/ruby/2.4.0/bin:$PATH
    ENV GEM_PATH /fluentd/vendor/bundle/ruby/2.4.0
    ENV GEM_HOME /fluentd/vendor/bundle/ruby/2.4.0
    # skip runtime bundler installation
    ENV FLUENTD_DISABLE_BUNDLER_INJECTION 1

    COPY Gemfile* /fluentd/
    RUN set -ex \
        && apk upgrade --no-cache \
        && apk add sudo \
        && apk add su-exec \
        && apk add --no-cache ruby-bundler \
        && apk add --no-cache --virtual .build-deps \
            build-base \
            ruby-dev \
            libffi-dev \
        && gem install bundler --version 1.16.1 \
        && bundle config silence_root_warning true \
        && bundle install --gemfile=/fluentd/Gemfile --path=/fluentd/vendor/bundle \
        && gem install fluent-plugin-out-http-ext -v 0.1.10 \
        && apk del .build-deps \
        && gem sources --clear-all \
        && rm -rf /tmp/* /var/tmp/* /usr/lib/ruby/gems/*/cache/*.gem

    # Copy configuration files
    COPY ./conf/fluent.conf /fluentd/etc/
    COPY ./conf/kubernetes.conf /fluentd/etc/

    # Copy plugins
    COPY plugins /fluentd/plugins/
    COPY entrypoint.sh /fluentd/entrypoint.sh
    RUN chmod +x /bin/entrypoint.sh

    # Environment variables
    ENV FLUENTD_OPT=""
    ENV FLUENTD_CONF="fluent.conf"
    ENV FLUENT_UID=0

    # jemalloc is memory optimization only available for td-agent
    # td-agent is provided and QA'ed by treasuredata as rpm/deb/.. package
    # -> td-agent (stable) vs fluentd (edge)
    #ENV LD_PRELOAD="/usr/lib/libjemalloc.so.2"
See in bold where we added the fluent-plugin-out-http-ext.
Run the following command in the same directory as the Dockerfile
docker build -t lint-dset .
Next tag and push the image to your favorite repository
I’ve already created one and its available here:
gcr.io/learning-containers-187204/lint-dset
What we have now done is to build an image that can now take two variables when deploying the Kubernetes daemonset enabling connectivity to Log Intelligence.
Configuring and deploying the Fluentd Daemonset
In the same location that you cloned the fluentd daemonset from github, modify the fluentd-daemonset-syslog.yaml in the following directory
cp ~/fluentd-kubernetes-daemonset/fluentd-daemonset-syslog.yaml fluentd-daemonset-LINT.yaml
Modify the fluend-daemonset-LINT.yaml as follows:
apiVersion: extensions/v1beta1
kind: DaemonSet
metadata:
  name: fluentd
  namespace: kube-system
  labels:
    k8s-app: fluentd-logging
    version: v1
    kubernetes.io/cluster-service: "true"
spec:
  template:
    metadata:
      labels:
        k8s-app: fluentd-logging
        version: v1
        kubernetes.io/cluster-service: "true"
    spec:
      tolerations:
      - key: node-role.kubernetes.io/master
        effect: NoSchedule
      containers:
      - name: fluentd
        image: gcr.io/learning-containers-187204/lint-dset
        env:
          - name:  LINT_HOST
            value: "XXXX"
          - name:  LINT_TOKEN
            value: "YYYYY"
        resources:
          limits:
            memory: 200Mi
          requests:
            cpu: 100m
            memory: 200Mi
        volumeMounts:
        - name: varlog
          mountPath: /var/log
        - name: varlibdockercontainers
          mountPath: /var/lib/docker/containers
          readOnly: true
      terminationGracePeriodSeconds: 30
      volumes:
      - name: varlog
        hostPath:
          path: /var/log
      - name: varlibdockercontainers
        hostPath:
          path: /var/lib/docker/containers
Note the modifications to the yaml file above in bold.
Now simply run the daemonset.
kubectl create -f fluentd-daemonset-LINT.yaml
Ensure the fluentd daemonset is up:
    ubuntu@ip-172-31-9-213:~/fluentd-kubernetes-daemonset$ kubectl get pods -n kube-system
    NAME                                                      READY     STATUS    RESTARTS   AGE
    fluentd-4jmtm                                             1/1       Running   3          18d
    fluentd-jm9sh                                             1/1       Running   4          18d
    fluentd-qf79m                                             1/1       Running   3          18d
Once the daemonset is up, check in Log Intelligence for your logs.


